Overview
Following the work described in previous two notebook entries, we narrowed the set of studies to two of the five that had the most similar experimental design, being that they worked with samples that were labeled as tolerant/resistant or sensitive/susceptible (noting the difference in focus indicated by those terms). The two-step pipeline was further refined. To define the three LOSO folds, two batches were taken from the Proestou & Sullivan 2020 study (where two separate batches were designated) and one from the Proestou & Sullivan 2023 study, which had a single batch. Inherent in this choice was the notion that training a logistic regression on tolerant/sensitive sample DEG data and testing on resistant/susceptible sample data (and vice-versa) may produce inconsistent results, but we were curious about potential overlap in significant DEGs. Here, we simply present the plots showing those results. Further detail is left to a future notebook entry.
Plots
This list of genes for each plot in succession below is a subset of the plot that follows. Each plot differs simply in selection probablity threshold filter values.
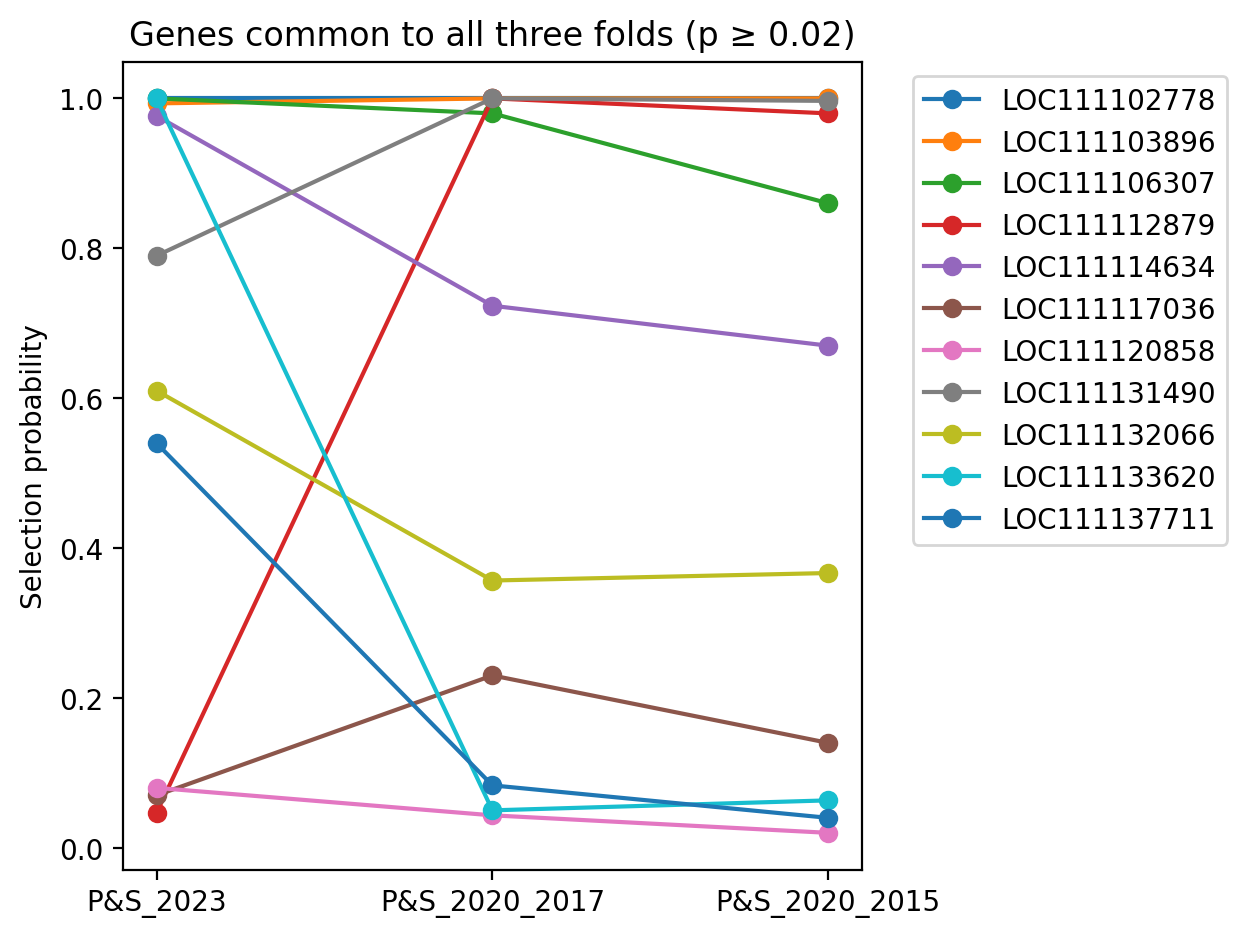
Genes common to all three folds, having selection probablity >= 0.02 for all three folds.
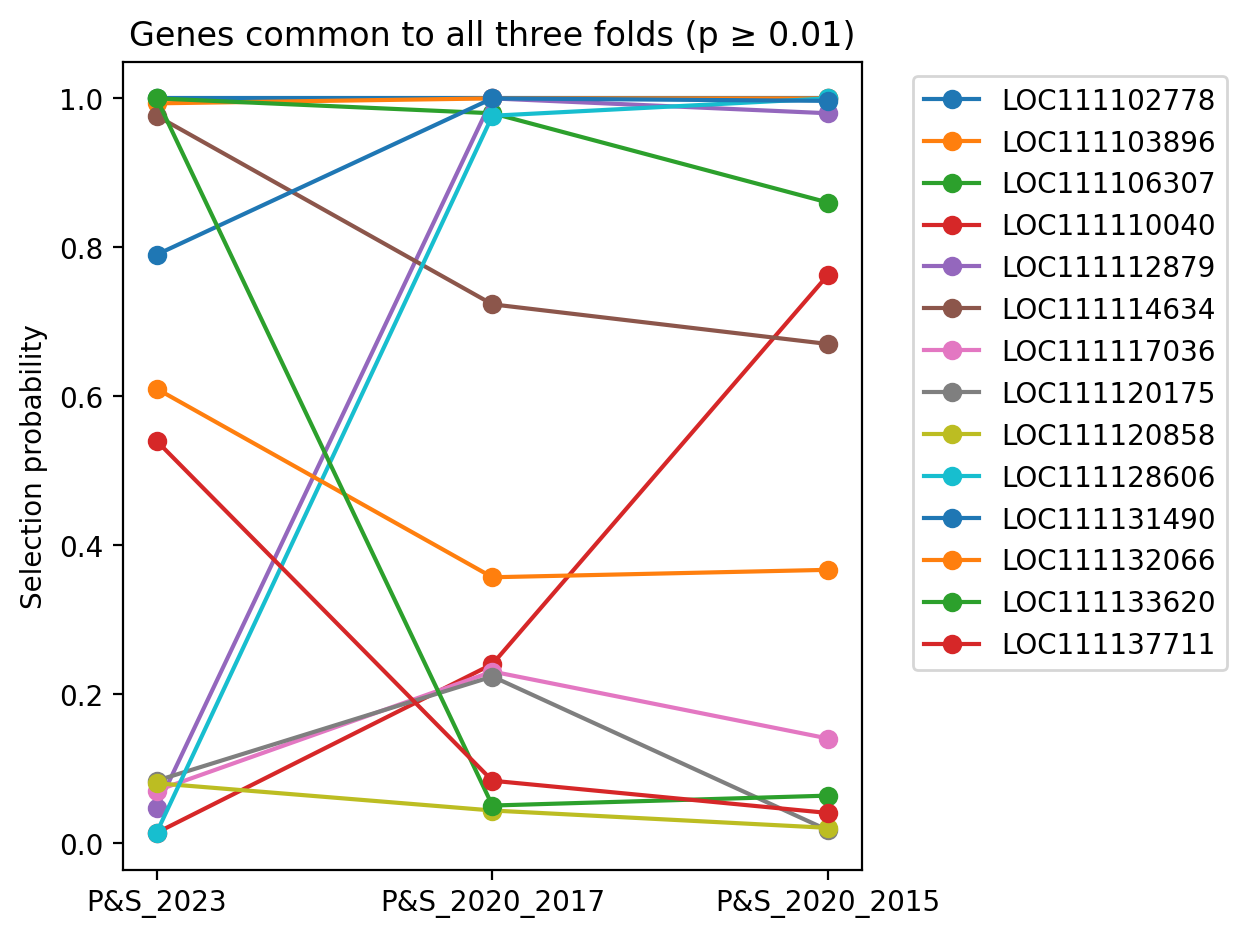
Genes common to all three folds, having selection probablity >= 0.01 for all three folds.
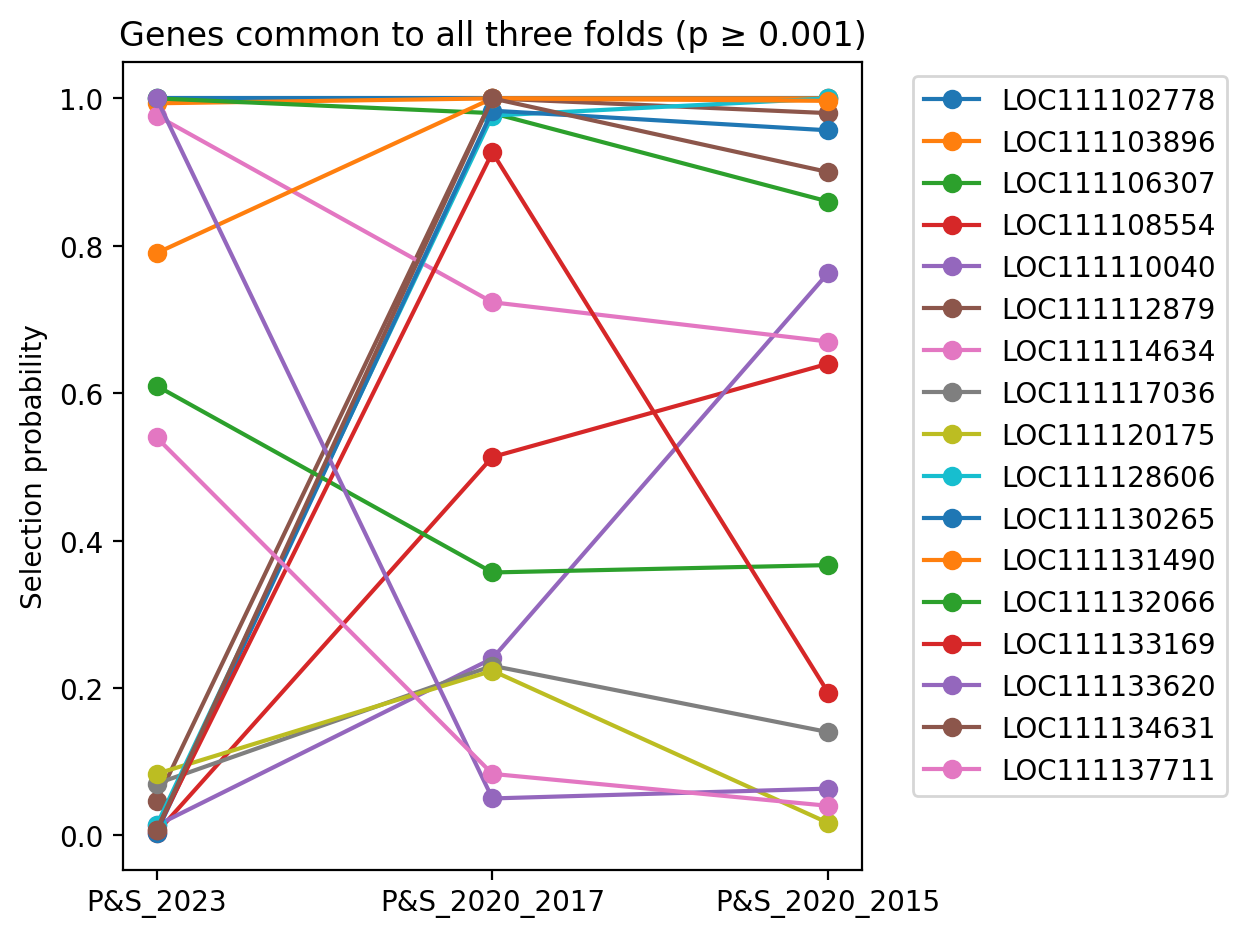
Genes common to all three folds, having selection probablity >= 0.001 for all three folds, and further having a minimum selection proabability >= 0.2 for at least one fold.