Abstract
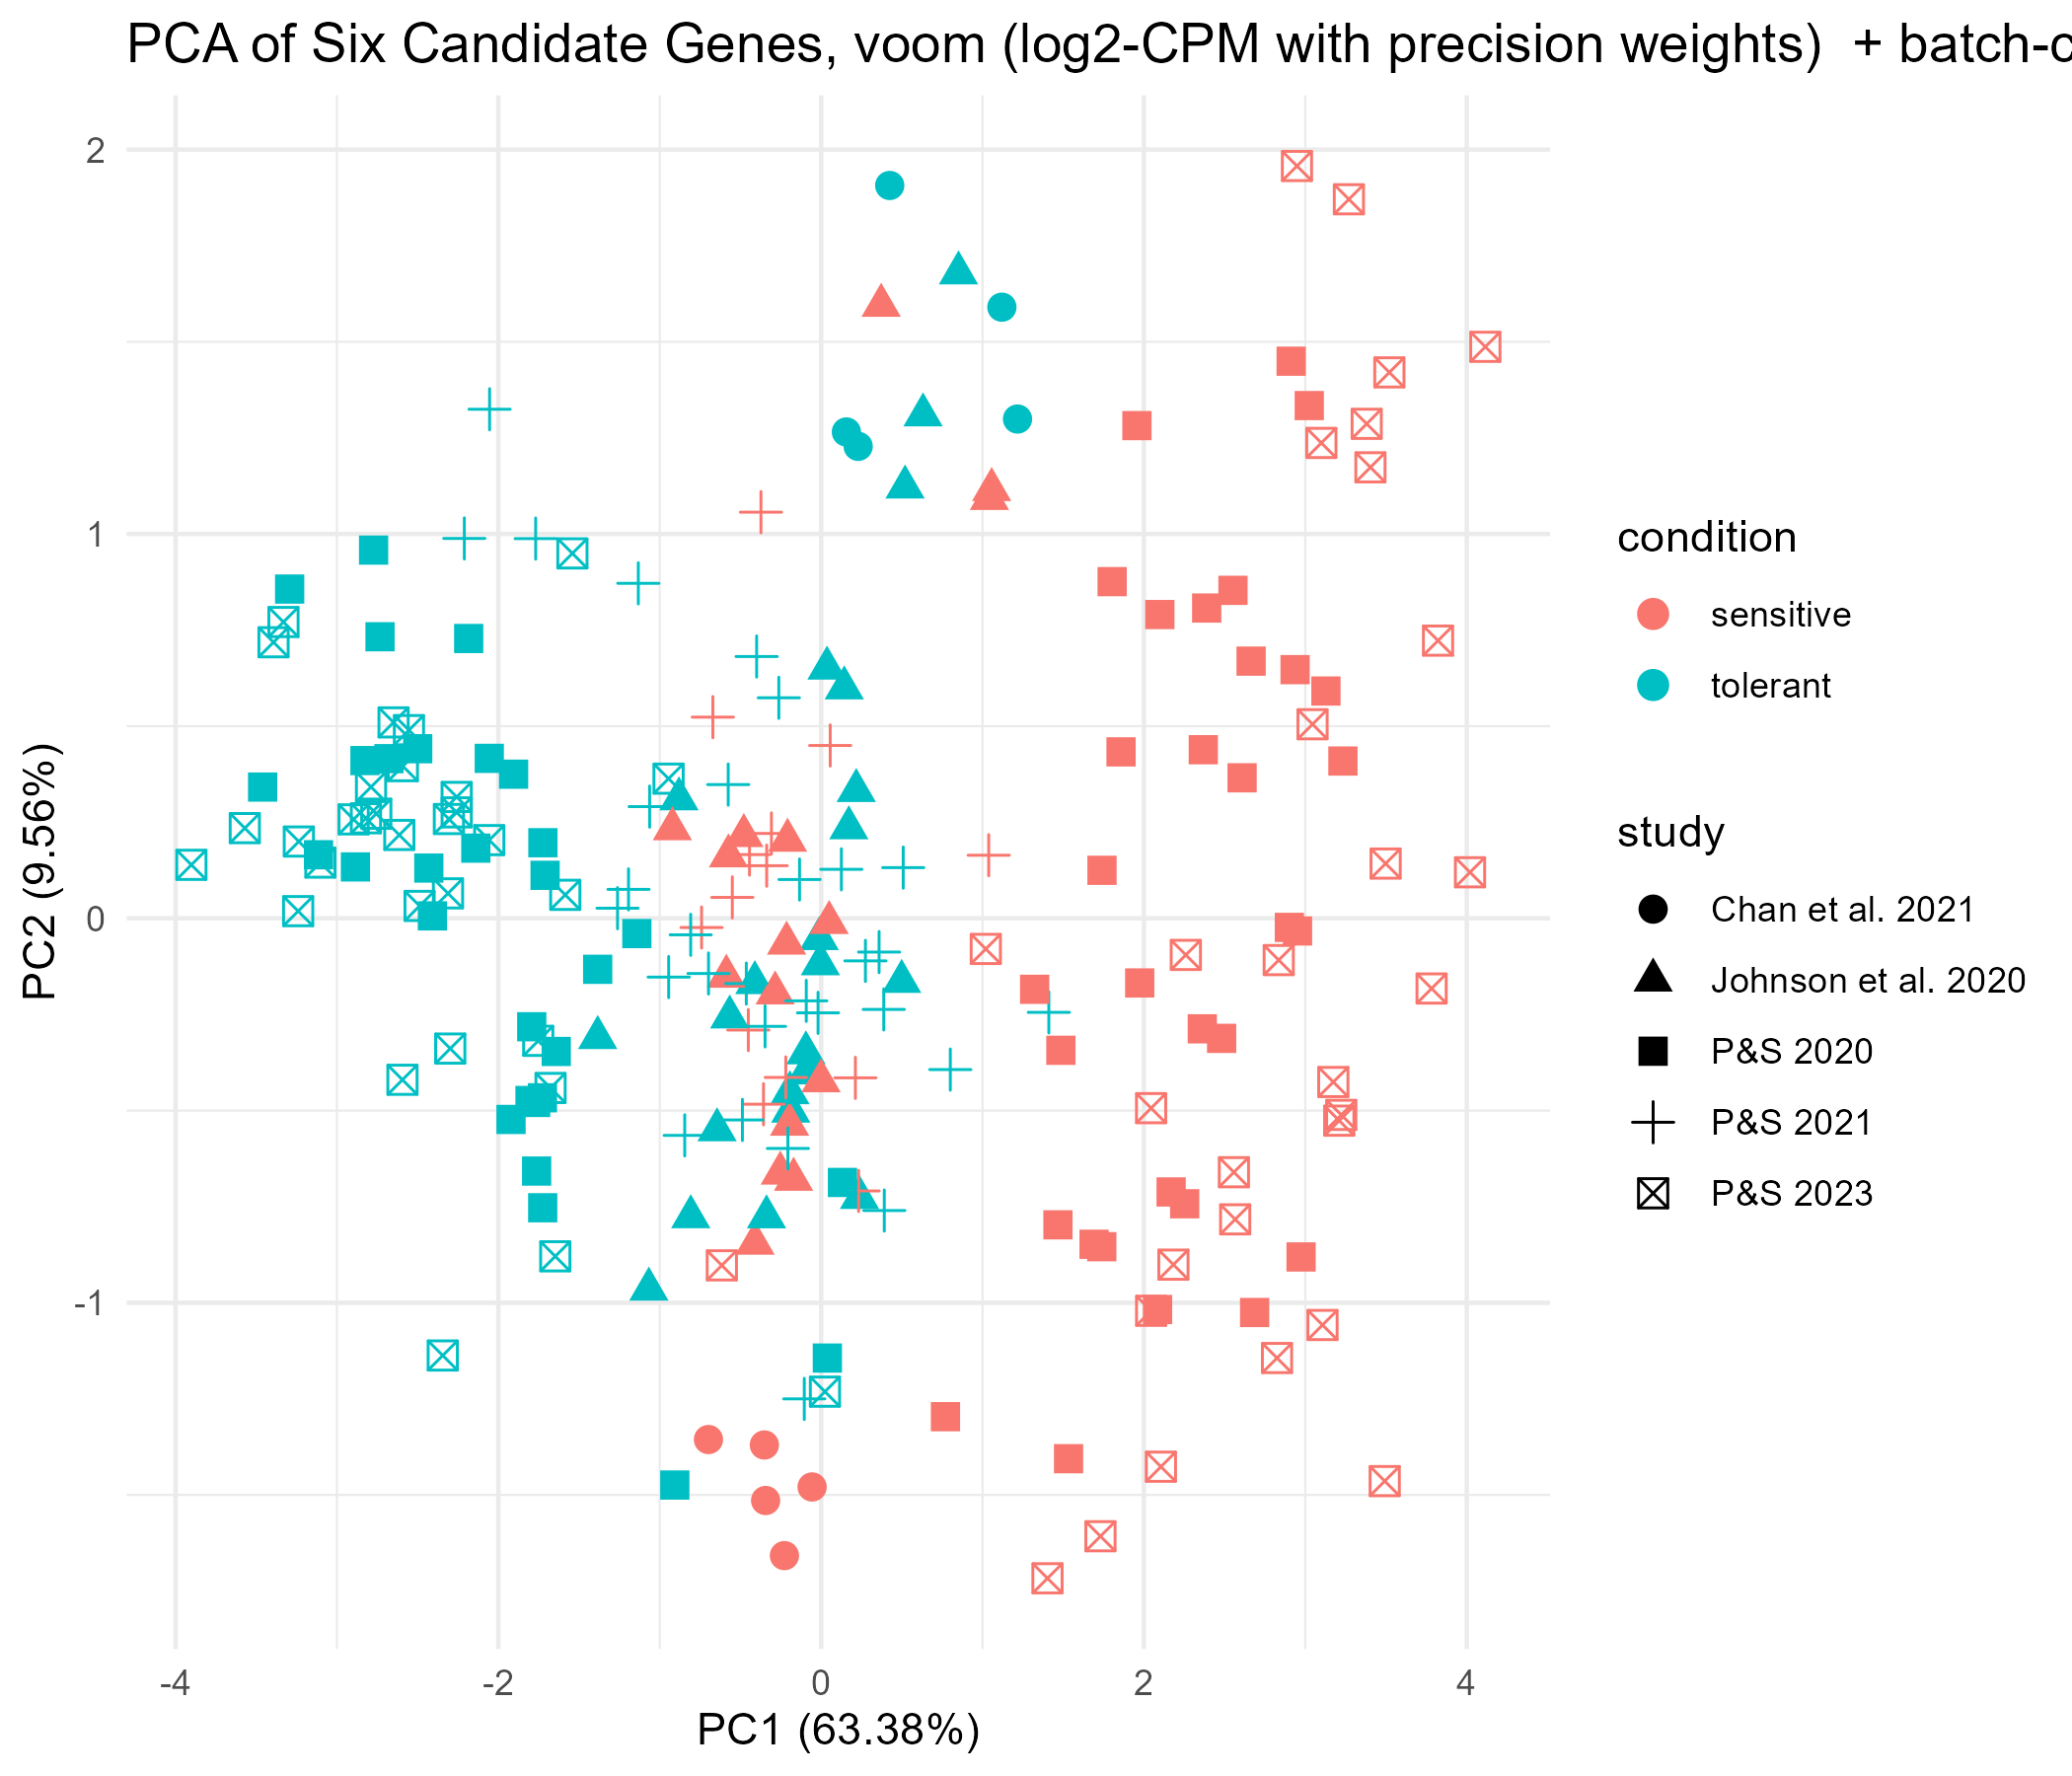
Given the six genes identified as potential tolerant/senstive biomarkers, we explored PCA plots, dendograms, and heatmaps across all five studies. We did this first for all study data combined, and then separately for each study.
Discussion
The work discussed in the notebook entry Two-Script Pipeline for Gene-Expression Classifier resulted in identifying a final panel gene list of six genes as candidates for a simple biomarker for resilience/sensitivity to P.Marinus (independent of exposure/treatment, as noted in the notebook entry Series of DESeq2 runs indicates innate DEGs for tolerance) In the current work, we used only those six genes to produce a PCA plot, dendogram, and heatmap across all five studies, looking for association with tolerance/sensitivity. The result was a PCA that, as expected, showed very good separation between sensitive and tolerant samples for the two studies used to identify the six biomarker genes. It also showed good separation for the Chan et al study, but not as good for the P&S 2021 nor the Johnson et. al study. We then produced plots for each of the studies separately, with the notion that pooling of data may have overwhelmed PCA. Separation was more notable here in P&S 2021, but still not in the Johnson et. al study.
Details
I used ChatGPT to generate an R script.
Resulting plots (click for per-study plots, dendograms, and heatmaps)
